Costs and the numbers
Restaurant labor shortage in 2026: the data, dated and sourced
Eased, not over. Restaurant quit rates still run about twice the private-sector rate and openings stay above average. Figures as published on 15 Oct 2026.

WaiterPilot Research
Updated , 8 min read
The short answer
The restaurant labor shortage has eased but not ended. In 2025, accommodation and food services had a monthly quits rate of 4.2% against 2.2% for all private industry, and a job openings rate of 5.6% against 4.5% (BLS JOLTS). About a third of operators still say they lack the staff to meet demand (NRA, reported April 2026).
Key points
- Accommodation and food services lost 4.2% of its workers to quits each month in 2025, about twice the 2.2% private-sector rate (BLS JOLTS).
- The sector's job openings rate fell from 9.5% in 2022 to 5.6% in 2025, still above the 4.5% private-sector rate.
- About a third of operators say they don't have enough employees to meet demand, down sharply from 2021 (NRA, reported by FE&S, April 2026).
- BLS projects about 423,100 openings for waiters and waitresses each year, mostly to replace people who leave.
- Figures as published on 15 Oct 2026; each source's own date is shown next to its figures.
On this page
The restaurant labor shortage has eased, but it hasn’t ended. Restaurants and hotels still lose workers to quits at about twice the rate of the private sector as a whole, and they still have more open jobs, proportionally, than the average employer. What changed since 2021 is the size of the gap: operators who say they can’t staff to meet demand are now about one in three, not most of them.
Figures as published on 15 Oct 2026. Every number links to its source, with the date it covers.
One note before the tables. The Bureau of Labor Statistics (BLS) Job Openings and Labor Turnover Survey (JOLTS) reports accommodation and food services as one industry group. It includes hotels as well as restaurants and bars. There is no restaurant-only quits rate in the tables we used.
What are the latest numbers?
Short answer: in August 2026, accommodation and food services had 713,000 open jobs and a quits rate of 3.5%, against 2.1% for all private industry (preliminary, seasonally adjusted).
| Measure | Figure | Period | Source |
|---|---|---|---|
| Job openings, accommodation and food services | 713,000 (rate 4.7%) | August 2026, preliminary, seasonally adjusted | BLS JOLTS Table 1 |
| Quits rate, accommodation and food services | 3.5% a month | August 2026, preliminary, seasonally adjusted | BLS JOLTS Table 4 |
| Quits rate, total private | 2.1% a month | August 2026, preliminary, seasonally adjusted | BLS JOLTS Table 4 |
| Quits rate, accommodation and food services | 4.2% a month | 2025 annual average, not seasonally adjusted | BLS JOLTS Table 22 |
| Job openings rate, accommodation and food services | 5.6% | 2025 annual average | BLS JOLTS Table 16 |
| Quits, accommodation and food services | 7.24 million | 2025 | BLS JOLTS Table 21 |
| Operators short of staff for current demand | 32% | 2026 survey | NRA, reported by FE&S, 28 Apr 2026 |
| Restaurant and foodservice jobs, projected | 15.8 million | 2026 | NRA, 12 Feb 2026 |
Monthly JOLTS figures are preliminary and get revised the following month. Monthly and annual figures also differ in method (seasonally adjusted or not), so compare months with months and years with years.
Is the shortage getting better or worse?
Short answer: better since 2022, and roughly flat between 2024 and 2025.
| Year | Quits rate, accommodation and food services (monthly average) | Job openings rate, accommodation and food services |
|---|---|---|
| 2021 | 5.8% | not in our extract |
| 2022 | 5.8% | 9.5% |
| 2023 | 5.0% | 7.2% |
| 2024 | 4.1% | 5.8% |
| 2025 | 4.2% | 5.6% |
| 2025, total private for comparison | 2.2% | 4.5% |
Sources: BLS JOLTS Table 22 (quits, not seasonally adjusted) and Table 16 (openings).
The openings rate fell by more than a third between 2022 and 2025, and the quits rate came down from its 2021 and 2022 peak. But the 2025 quits rate is still about twice the private-sector rate, and it ticked up slightly from 2024. The National Restaurant Association’s March 2025 report said restaurant turnover “fell to an 11-year low for restaurants and accommodations in 2024”, and that two years earlier there were “approximately 2 job openings for every unemployed individual” (NRA Workforce Technology, March 2025, p. 4). Both things are true: the worst is over, and churn is still the normal state.
How many restaurant workers quit?
Short answer: 7.24 million quits in accommodation and food services in 2025, about one in five of all private-sector quits.
That is 7,243 thousand quits out of 35.8 million across all private industry (BLS JOLTS Table 21). A quit is counted each time someone leaves, so one job that turns over three times in a year counts three times.
What does a 4.2% monthly quits rate mean for one restaurant? Here is the arithmetic for a fictional team.
Casa Olivo is a fictional restaurant we use for examples (an example, not a customer). The assumption that the industry average applies to it is ours; a single restaurant can be far above or below the average.
| Line | Casa Olivo (example) | If it matched the total private rate |
|---|---|---|
| Staff on the payroll, front and back of house | 30 | 30 |
| Monthly quits rate | 4.2% (2025 industry average) | 2.2% (2025 total private) |
| Expected quits per month (30 × rate) | about 1.3 | about 0.7 |
| Expected quits per year (× 12) | about 15 | about 8 |
So a 30-person team at the industry average would expect to replace about 15 positions a year, against about 8 for an average private employer. Each of those is a hire, a first shift and a training period. If you want to put a dollar figure on that, our post on the cost of server turnover works it out with every assumption shown.
What do restaurant operators say?
Short answer: hiring is still a top problem, but fewer operators say they are short-staffed than in 2021 or 2024.
| Finding | Published | Source and type |
|---|---|---|
| “77% of operators say recruiting and retaining employees is still a leading challenge”, though “turnover is at its lowest rate in a decade” | 6 Feb 2025 | NRA, trade association |
| 32% say they “don’t have enough employees to support existing customer demand”, down 10 points from 2024 and 56 points from 2021; 33% found open positions harder to fill than in 2024; 35% had lower staffing than a year before | 28 Apr 2026 | NRA, reported by FE&S; secondary, as we could not open the NRA original |
| Operators expect to add “more than 100,000 jobs” in 2026; “nearly three quarters of operators plan to hire” | 12 Feb 2026 | NRA, trade association |
| “Last year, 42 percent of operators reported their restaurant was not profitable” | 12 Feb 2026 | NRA, trade association |
A caution on the 32%: other outlets have reported 22%, 32% and 45% for different waves of the NRA’s staffing survey. We cite it as “about a third, per the NRA, as reported by FE&S”.
The profitability line matters for staffing too. When four in ten operators say they were not profitable, every extra hour of re-hiring and training comes out of a thin margin.
Who works in restaurants, and what do they earn?
Short answer: a large, young workforce, paid a median of $16.94 an hour for servers, tips included.
| Measure | Figure | Period | Source |
|---|---|---|---|
| Waiters and waitresses employed in the US | 2,284,400 | 2025 | BLS Occupational Outlook Handbook, page updated 27 Aug 2026 |
| Projected employment growth | “2 percent from 2025 to 2035” | 2025 to 2035 | same |
| Projected openings each year | “about 423,100” | average, 2025 to 2035 | same |
| Median wage, waiters and waitresses | $16.94 an hour; $35,230 a year (tips included) | May 2025 | same |
| Restaurant and foodservice employees under 25 | 40% (13% across the whole workforce) | Census ACS 2024 data | NRA Restaurant Employee Demographics, March 2026 |
| Waitstaff under 25 | 52% | Census ACS 2024 data | same |
The BLS projections tell the real story. Server jobs are expected to grow only 2% in ten years, yet there will be about 423,100 openings a year. Nearly all of those openings exist because people leave and must be replaced. The shortage, where it remains, is mostly a churn problem, not a growth problem.
What do the numbers mean for running a dining room?
Short answer: plan for steady re-hiring, make new staff productive in their first shifts, and spend scarce server time on guests rather than on carrying orders.
Four practical conclusions, none of which needs any software:
- Expect turnover as the normal state. At the industry average, a 30-person team replaces about 15 positions a year. Budget training time for it.
- Make every tool learnable in one shift. With 52% of waitstaff under 25 and high churn, a system that needs a week of training will always have someone who hasn’t finished it.
- Keep the jobs that need a person with a person. Hospitality, judgment calls and allergy questions belong with staff. Order-taking and routine questions can be shared. Our post on jobs to take off short-staffed servers goes through them one by one.
- Train the floor for the busy hour, not the average hour. See the rush hour playbook.
Operators seem to agree on where technology fits. In the NRA’s Restaurant Technology Landscape Report 2024, 69% said technology “will augment rather than replace human labor” (NRA, 2024).
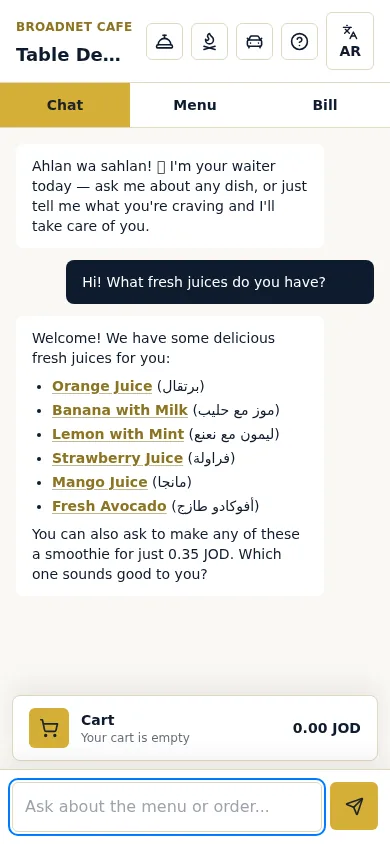
That is how WaiterPilot is built. Guests order by chat from their own phone and get answers from your menu, or are told to ask a staff member when the menu doesn’t say. The first order at each table waits for a staff member to confirm. Waiter calls and check requests appear on the floor screen within seconds. Staff make and serve the food and work from screens on the phones or tablets they already have. We don’t claim it lowers turnover, and we don’t have data that it does. It costs $200 per location per month after 30 days free. See how it works for the full flow.
How often do these sources update?
| Source | How often it updates | What it would change here |
|---|---|---|
| BLS JOLTS Tables 1 and 4 | Monthly (preliminary, then revised) | The “latest numbers” table |
| BLS JOLTS Tables 16, 21 and 22 | Once a year, with annual averages | The year-by-year table and the quits arithmetic |
| BLS Occupational Outlook Handbook | Usually once a year | Employment, wage and projected openings |
| National Restaurant Association surveys | Several reports a year | The operator table |
For anything newer than 15 Oct 2026, follow the source links above.
What to do next
Work out your own quits rate: count the people who left in the past twelve months, divide by your average headcount, and divide by 12 for a monthly figure you can set against the 4.2% average. Then look at where your servers’ time goes on a busy night. If a lot of it is walking orders to the kitchen and answering the same menu questions, try a sample order to see how WaiterPilot handles that part, or read the onboarding checklist to see what a new team member would need to learn.
Questions readers ask
Is there still a restaurant labor shortage in 2026?
It has eased but not ended. The job openings rate in accommodation and food services fell from 9.5% in 2022 to 5.6% in 2025, but it is still above the 4.5% private-sector rate, and about a third of operators say they lack the staff to meet demand.
What is the restaurant employee turnover rate?
BLS doesn't publish a single restaurant turnover rate, but its JOLTS survey shows accommodation and food services had a monthly quits rate of 4.2% in 2025, about twice the 2.2% rate for all private industry. That industry group includes hotels as well as restaurants.
How many restaurant workers quit each year?
BLS counted 7.24 million quits in accommodation and food services in 2025, out of 35.8 million across all private industry. That is about 20% of all private-sector quits.
How much do servers earn in the US?
The median wage for waiters and waitresses was $16.94 an hour, or $35,230 a year, in May 2025, according to BLS. BLS notes that tips are included.
How current are these figures?
Figures as published on 15 Oct 2026. BLS releases new JOLTS data every month and the National Restaurant Association publishes several reports a year, so check the source links for newer numbers.
Sources
- Occupational Outlook Handbook: Waiters and Waitresses, US Bureau of Labor Statistics, 2026-08-27 (checked 2026-10-15)
- JOLTS Table 22. Annual average quits rates by industry and region, US Bureau of Labor Statistics, 2026 (checked 2026-10-15)
- JOLTS Table 21. Annual quits levels by industry and region, US Bureau of Labor Statistics, 2026 (checked 2026-10-15)
- JOLTS Table 16. Annual average job openings rates by industry and region, US Bureau of Labor Statistics, 2026 (checked 2026-10-15)
- JOLTS Table 1. Job openings levels and rates by industry and region, seasonally adjusted, US Bureau of Labor Statistics, 2026 (August 2026 data, preliminary) (checked 2026-10-15)
- JOLTS Table 4. Quits levels and rates by industry and region, seasonally adjusted, US Bureau of Labor Statistics, 2026 (August 2026 data, preliminary) (checked 2026-10-15)
- Persistent cost increases and enduring demand will shape the restaurant industry in 2026, National Restaurant Association, 2026-02-12 (checked 2026-10-15)
- The 2025 State of the Industry shows cautious optimism, National Restaurant Association, 2025-02-06 (checked 2026-10-15)
- Restaurant hiring conditions improve, though gaps persist (NRA Research Insight: Workforce Hiring and Staffing), FE&S, 2026-04-28 (checked 2026-10-15)
- Research Insight: Workforce Technology, National Restaurant Association, 2025-03 (checked 2026-10-15)
- Restaurant Employee Demographics, National Restaurant Association, 2026-03 (checked 2026-10-15)
- Restaurant Technology Landscape Report 2024, National Restaurant Association, 2024 (checked 2026-10-15)